Why Public Relations in Research Commercialization?

What is Public Relations? The Public Relations Society of America defines it as: “Public relations is a strategic communication process that builds mutually beneficial relationships between organizations and their publics.” Public relations is the art of crafting and delivering messages that inform and persuade the public, and get people to change opinions or take action. According to Public Relations Society of America some of the disciplines/functions within PR:

  • Corporate Communications
  • Crisis Communications
  • Executive Communications
  • Internal Communications
  • Investor Relations Communications
  • Marketing Communications
  • Integrated Marketing/Integrated Marketing Communications
  • Media Relations
  • Content Creation
  • Events
  • Social Media
  • Multimedia
  • Reputation Management
  • Speechwriting
  • Brand Journalism

There was a time when many companies did not see the value of public relations, unless a crisis happened, which, unfortunately, is usually too late. Today, the lines are blurring between the traditional definition of public relations and other forms of marketing. With an increasing portion of commercial activities occurring online, attitudes are changing; and more executives now see PR as a way of earning–and not interrupting– people’s online attention, and with that, gain publicity for free from trusted, unpaid or earned channels. According to the American Marketing Association, “Marketing is the activity, set of institutions, and processes for creating, communicating, delivering, and exchanging offerings that have value for customers, clients, partners, and society at large.” Marketing is much broader than public relations; it involves communicating but is more comprehensive. One approach is to categorize the media assets as owned, earned or paid. Owned media is content and brand assets like images that you create and typically protect with trademarks and copyrights. Paid media is advertising where you are paying some media outlet to place or amplify your messages. Earned media is where others voluntarily share your message. Content marketing often supports PR goals; but content marketing goes beyond public relations. In a world of increasing information sharing, the line between public relations marketing versus social media marketing is often blurry. Both can provide value in positioning your brand messaging within their respective media outlets and audiences, with differences in reach, tone, immediacy and degree of customer engagement required.

Robert Cialdini coined[1] the term Social Proof to describe a social and psychological phenomenon where people copy the actions of others in a given situation. Social Credibility is the ability to connect and engage with other people and may be measured by the number of connections or followers on social media or audience sizes of other online media. Online media and digital marketing are intimately engaged and continuing to evolve. Audiences increasingly rely on online tools such as search engines to locate the information they need for purchase decisions. Establishing social credibility through reinforcement of messages from multiple sources becomes important for both search engines and the humans using them. While definitions and categorizations are helpful to understand the field, for commercial practitioners it is a matter of selecting the appropriate tools to meet the business objectives.

Business objectives for PR campaigns generally revolve around objectives such as: creating/ enhancing online presence; increasing brand credibility; increasing leads/sales/profits; or changing the way people thing about a business. These objectives could also be targeted towards particular audiences e.g. potential customers, investors/ acquirers, employees, regulators etc.  For many, the process of crafting the value proposition and messaging is itself of significant value because of the clarity it can bring to the business.  This is particularly relevant for early stage technology research commercialization efforts where startups may need to both pivot their strategies and validate their approaches with larger audiences as they attempt to scale. Such startups may have awesome content on their websites but struggle to bridge the chasm between early adopters in their niche and larger audiences who don’t know they exist or what value they can deliver. SEO optimization of the content does not engage broader audiences. Social influencers can provide some attention from their followers, but the fit of their audience may be difficult to match with the firm’s business objectives. Dedicated PR firms can provide value; but these may be expensive for cost conscious startups. Approaches like Macadamia Media may be a cost-effective compromise to raise exposure; and bring the traffic to the startup’s content.


[1] Cialdini, R. B. (1984). Influence: The new psychology of modern persuasion. Morrow.

Did the expected NFV OPEX savings materialize?

When the operators issued their whitepaper[1] challenging the industry to address network function virtualization in 2012, the expected benefits included a number of improvements in operating expenses. These included improved operational efficiency by taking advantage of the higher uniformity of the infrastructure via:

  • IT orchestration mechanisms providing automated installation, scaling-up and scaling out of capacity, and re-use of Virtual Machine (VM) builds.
  • More uniform staff skill base: The skills base across the industry for operating standard high volume IT servers is much larger and less fragmented than for today’s telecom-specific network equipment.
  • Reduction in variety of equipment for planning & provisioning. Assuming tools are developed for automation and to deal with the increased software complexity of virtualisation.
  • Mitigating failures by automated re-configuration and moving network workloads onto spare capacity using IT orchestration mechanisms, hence reducing the cost of 24/7 operations.
  • More efficiency between IT and Network Operations- shared cloud infrastructure leading to shared operations
  • Support in-service software upgrade (ISSU) with easy reversion by installing the new version of a Virtualised Network Appliance (VNA) as a new Virtual Machine (VM).

While there have been a number of studies addressing the potential for capex improvements (see e.g., (Naudts, et.al. 2012)(Kar et.al. 2020)), there are relatively fewer studies in the literature concerning the opex improvements (see e.g., (Hernandez-Valencia et.al. 2015)(Bouras et.al. 2015)(Karakus & Durresi 2019)). At least partly, this reflects the commercial sensitivity of expense data at network operators. Headcount is a significant cost factor in operations. Opex improvements could imply headcount reductions which would also make the topic sensitive for network operator staff.

The transformative nature of NFV, transitioning equipment spend from custom hardware to software on generic computing infrastructure, generated significant interest and rhetoric at the time (see e.g., Li & Chen 2015)), but other new technology introductions have also claimed significant opex improvements (e.g., GMPLS (Pasqualini et.al. 2005)). Telecommunications operators are large-scale businesses, so opex reductions are an ongoing area of focus. The telecom industry is characterized by significant capital investments in infrastructure leading to significant debt loads. Average industry debt ratios have been in the range 0.69 to 0.81 over the past few years (readyratios.com), implying operating expenses would include a significant component for depreciation and amortization. Examining the annual reports of tier 1 carriers shows depreciation and amortization in the range of 15-20% of operating expenses. Telecom services are mass market services, implying significant sales expenses to reach the mass market. Examining the annual reports of tier 1 carriers shows sales, general and administrative costs are on the order of 25% of operating expenses. The operations efficiency improvements expected for NFV don’t impact Depreciation or SGA expenses, hence at most they can impact the remaining 55-60% of the company’s total operating expenses.

(Bouras et. al. 2016) expected opex reduction of 63% compared to their baseline, but it is not clear how that would relate to reportable operating expenses for the company. (Hernandez-Valencia, et.al. 2015) also provided numerical percentage ranges for expected savings in a number of areas, but the relation to reportable operating expenses for the company is similarly unclear. Other studies (Karakus & Durresi 2019) (Pasqualini et al 2005) identified factors affecting operating expenses but did not have consistent terminology or scope in the operating expense factors identified. Environmental operations costs of power and real estate were identified by (Hernandez-Valencia, et.al. 2015) and (Pasqualini et al 2005), but (Karakus & Durresi 2019) refer only to energy related costs. (Hernandez-Valencia, et.al. 2015) identified service operations costs of assurance and onboarding; (Karakus & Durresi 2019) identified service provisioning; and (Pasqualini et al 2005) referred to service management processes – SLA negotiations, service provisioning, service cessation, service move/change.

The lack of consistent operating cost models may be explained by variation across operators. Service definitions and designs may be different across operators. Environmental operations expenses like real estate and power could be affected significantly by operators’ preferences for private vs public cloud infrastructures. The design of operations reflects company’s strategic choices on what to capitalize as fixed infrastructure and may be influenced by other factors (e.g. tax policies, regulatory regimes). Numerical targets for opex reductions seem difficult to generalize across organization. Even within a single organization, tracking such targets at the corporate level may be significantly impacted by other corporate activities (e.g., M&A) that impact reportable metrics.  A better approach may be to focus on improvements in particular operational tasks that can be generalized across multiple operators and architectures.

References

Naudts, B., Kind, M., Westphal, F. J., Verbrugge, S., Colle, D., & Pickavet, M. (2012, October). Techno-economic analysis of software defined networking as architecture for the virtualization of a mobile network. In 2012 European workshop on software defined networking (pp. 67-72). IEEE.

Kar, B., Wu, E. H. K., & Lin, Y. D. (2020). Communication and Computing Cost Optimization of Meshed Hierarchical NFV Datacenters. IEEE Access8, 94795-94809.

Hernandez-Valencia, E., Izzo, S., & Polonsky, B. (2015). How will NFV/SDN transform service provider opex? IEEE Network29(3), 60-67.

Bouras, C., Ntarzanos, P., & Papazois, A. (2016, October). Cost modeling for SDN/NFV based mobile 5G networks. In 2016 8th international congress on ultra-modern telecommunications and control systems and workshops (ICUMT) (pp. 56-61). IEEE.

Karakus, M., & Durresi, A. (2019). An economic framework for analysis of network architectures: SDN and MPLS cases. Journal of Network and Computer Applications136, 132-146.

Li, Y., & Chen, M. (2015). Software-defined network function virtualization: A survey. IEEE Access3, 2542-2553.

Pasqualini, S., Kirstadter, A., Iselt, A., Chahine, R., Verbrugge, S., Colle, D., … & Demeester, P. (2005). Influence of GMPLS on network providers’ operational expenditures: a quantitative study. IEEE Communications Magazine43(7), 28-38.


[1] https://portal.etsi.org/NFV/NFV_White_Paper.pdf

Go to Market Strategy

You have a product and need to find a way to get it in front of the right people. Basically, a Go-To-Market (GTM) strategy is a comprehensive action plan that details how. A GTM strategy is a business tool and a critical component of the organization’s business plans. More specifically, a GTM strategy is the plan of an organization, to deliver their unique value proposition to customers. Managers, product marketing specialists, and other decision-makers use the GTM strategy to coordinate their efforts and ensure a smooth launch of a new product, entry into an unfamiliar market, or the re-launch of a former brand/company. A regular marketing strategy is intended to be a long term set of rules, principles, and goals set in place to guide all of your messaging through the 5Ps of the marketing mix: Product/Price/Promotion/Place/People. A GTM strategy is a (relatively) short term, step-by-step map that focuses on launching one specific product. While each product has a different strategy, the end-goal is the same – to achieve a competitive advantage by optimizing the choices inherent in delivering the value proposition to. If your product is Point A and your customer is Point B, then a GTM strategy can be described as everything that happens along the path between the two. There may be lots of different paths, but a good GTM strategy is the plan for targeting the right pain point with the right sales and marketing processes, so you can grow your business at the optimum pace.

The components of a GTM strategy include figuring out marketing segmentation and messaging, a sales method, your ideal customer base, attractive pricing, and the unique problem your product solves or improves. This may involve engaging with a new market, or, may simply be presenting a new idea to your existing client base. The pricing strategy and the distribution plan aspects will certainly impact the results, but it is easy to bias these with company constraints if you start there. Today, however, businesses need to start with the customer before building pricing and distribution strategies. Your Target Market should provide a clear definition of your target audience. This definition involves the demographic, psychographic, geographical, and other variables that can help you narrow down your focus. While statistical data can provide some perspectives here, you’ll also need to create buyer personas to pin-point the ideal profiles that you want to target. Not all segments of the total market will be equally attractive. Market can be segmented in a variety of ways; but comparing the segments in terms of the business value vs implementation complexity can help focus on particular segment (e.g. between easy wins from those segments with high business value and low implementation complexity). All markets have their unique aspects, but broad categories such as Business to Business (B2B), Business to Consumer (B2C) or platforms supporting Consumer to Consumer (C2C) transactions can be helpful because target markets in these categories tend to have similar scale and regulatory issues. For example, B2B transactions are different to consumer transactions with an average of seven people involved in every business buying decision e.g.:

  • The initiator (who identifies your product/service as relevant)
  • The End User
  • The Buyer (funding the purchase)
  • The Decision maker (approving the purchase)
  • The final approver (depending on the organizations schedule of authorizations)
  • The Influencer (convincing decision makers of the purchase need)
  • The gatekeeper (who can kill the purchase decision for other reasons e.g. compliance with corporate security policies)   

The Value Proposition and Product Messaging (the problems it solves, etc.) are two other key components of your GTM strategy. These help you position your brand and provide clarity to your potential customers. The value proposition can be thought of as a compelling story that helps customers understand why they need the product or service to address a particular pain point. Developing buyer personas around these pain points can help clarify the value proposition and product messaging around that pain point. In the B2B context, additional personas for the other people involved in business buying decisions can be helpful. For example, an end user pain point might be the time taken on a particular operational task. The value proposition can then be derived around the time saved and appropriate messaging developed to emphasize saving time on this task. The pain point for an influence might be considerably different (e.g. the quality of data obtained from the operation) hence requiring different value proposition and messaging.  

For those of us who are attempting to build a new business, an incorrect or suboptimal GTM strategy can cost years in going the wrong direction with product development and marketing. Having a GTM strategy helps you keep a realistic, practical perspective, and lets you identify and pay appropriate attention to the less-exciting bits that are still fundamental to your success, if it is developed with quantifiable data rather than “gut feel”. Crucially, a solid and comprehensive GTM strategy will also give you a framework for measuring your progress along the way, and help you detect and diagnose any issues that are hampering your success before they have the chance to run your venture into the ground. Identifying appropriate metrics and benchmarks can help you evaluate the performance of implementation efforts, as well as validate the GTM strategy itself. Some interesting metrics include: pipeline coverage (ratio of prospects earlier in the pipeline to forecasted sales), Sales team performance (% above vs below forecasted quota); lead conversion rates, marketing /sales budgets as % of revenue.

Commercializing technology research obviously requires a GTM strategy when planning for commercial success. Any particular GTM strategy would depend on the specific circumstances of product/service characteristics, targeted markets, company resources etc. Even with a customized GTM strategy in hand, research commercialization efforts can experience difficulty gaining attention/traction in their target markets for a variety of reasons; but failing to develop an adequate GTM strategy significantly reduces the chances of success. An often overlooked aspect of the GTM strategy for startups is the role of public relations in establishing an online presence, building a brand and messaging the key value propositions. If you would like assistance developing your GTM strategy you can contact me.  

Towards Measuring Smart Contract Automation

Blockchains are an interesting new technology emerging into large scale commercial deployments for a variety of different applications. While cryptocurrencies were the initial application, the development of smart contracts has enabled a broader variety of transactions on blockchains. Financial transactions using blockchain smart contracts have become a significant element of broader transformations in the financial service industry. “FINTECH” refers generally to the broader transformation of financial services by technology solutions. “DeFi” refers to a more specific, though perhaps less widely supported transformation towards Decentralized Financial services using permissionless (or public) blockchains.

Smart contracts automate transactions of cryptocurrencies and other tokenized digital assets between account holders. Smart contracts execute on the blockchain; and use the block to maintain transaction state information. Some smart contracts may also use oracles to interact with cyber-physical resources, off chain computing resources or other information sources. Not every smart contract is required to have legal significance, but generally this is required for financial transactions above a certain size so that legal recognition and enforcement of the financial transaction can be available.

The scope of a legal contract is a fundamental factor in any legal contractual dispute. Generally, disputes over contract scope center around whether the contract is completely contained in a single document, or whether there are additional contractual terms captured elsewhere. An analogous problem exists in the context of smart contracts as to the scope of the agreement. The academic literature has recognized a continuum of solutions between two extremes (a) the code is the contract vs (b) the code is an implementation of a separate legal document. In practice, not all the terms and clauses of a typical legal contract are executable by a smart contract, hence intermediate solutions are desirable. Intermediate solutions include (i) the annotation of code with legal terms that are not executable by the smart contract, or (ii) the annotation of traditional contractual language to identify terms that might be computable by a smart contract. It may be easier to think of these intermediate solutions as targeting different types of users. Type (i) smart contracts might be of particular interested to software developers operating in a relatively fixed legal environment. Type (ii) smart contracts might be considered of particular relevance to lawyers and other non- software developers that are interested in focusing on the terms and clauses without being so concerned about the software implementation mechanics. Templated legal contracts have previously been used for contract automation, and this approach also applies for type (ii) smart contracts.

Given the dissonance in practical implementations between the scope of the legal contract and the corresponding executable smart contracts, it becomes interesting to consider how to measure the gap between these entities. Clack (2018) considered comparing the semantic differences, but legal prose and computer source code are recorded with vastly different levels of precision, making this approach difficult.  The ISDA (2018) whitepaper, in considering the automation of derivates contracts via smart contracts, distinguishes between the contract terms that should or could be automated within the overall scope of terms in derivative contracts. Templated contracts provide a mechanism to identify the specific elements of the contract which are computationally significant.  Some comparison of the quantity of computable terms within a contract compared to the size of the overall contract may therefore provide a useful perspective on the degree of automation of the contract.

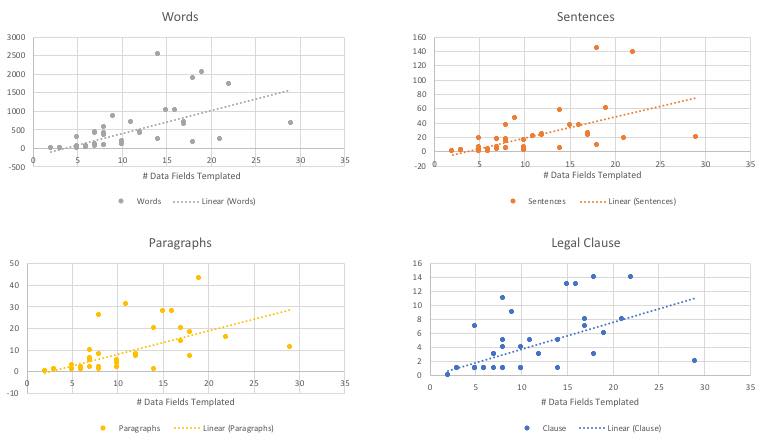
There are a number of tools and methods for capturing templated contracts. Similarly, a variety of languages exist for encoding the corresponding smart contract.  Several of these are even available, to varying degrees, in open source, thus enabling easier access for study. Project Accord[1], hosted by the Linux Foundation, is one such open source project providing tools and templates for smart legal contracts. In particular, this project provides[2] (as of 9/1/2020) a repository with 51 examples of contract text with corresponding data structures for the data fields that are computable within the smart contracts.  The figure below provides plots of various measures of the size of the legal clause or contract (# words, # sentences, # paragraphs, # clauses) vs counts of the number of data fields that were templated with a linear trendline for reference. These plots show an increasing trend of number of templated terms with the size of the contract.  But the number of data fields templated as rather low in comparison to the size of the contracts with (on average) <5 per legal clause, <2.5 per paragraph, < 1.5 per sentence, and overall <10% of words were templated as data fields.

This corpus may be rather small; a larger corpus may provide for more statistical rigor. This corpus is also intended as exemplary; it is an aid to illustrate the operation, and feasibility, of the smart contract functionality provided by accord. In that sense, it may not be representative of commercial smart contracts in operation on various blockchains.

If we consider the templated data fields as being the terms that should be automated in ISDA’s parlance, having only 10% of the words in this category would seem to indicate that a relatively low degree of automation at present. This may be indicative of the current state of the technology, where the easier use cases are automated first.  It would be interesting to better understand the limits of the contract terms that could be automated via smart contracts. Some grammatical constructs of natural language (e.g., “the”, “of” may have no 1:1 semantic equivalent in computation. Some typical legal clauses (e.g., choice of law, choice of venue) may require action by parties off the blockchain that are difficult to automate in a smart contract. Hence, the limits of how many words in a legal contract may have computational significance in a smart contract may be less than 100%.   

References

Clack, C. D. (2018). Smart Contract Templates: legal semantics and code validation. Journal of Digital Banking2(4), 338-352.

ISDA, (2018) White paper: Smart Derivatives contracts: from Concept to Construction.


[1] https://accordproject.org/

[2] https://templates.accordproject.org/